Eastern Rosella
Platycercus eximius
ABR description
The following is extracted from the Annual Bird Report for the twelve months to June 2017.
Very common, breeding resident
A resident of the grassy woodlands in and around the ACT.
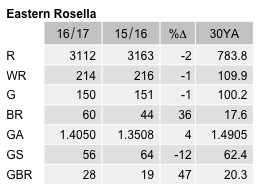
General: Reporting rate 22.4%, 17% lower than last year and 22% lower than the 30YA representing a decline of 28% since 2013-14 and the lowest rate since 1998-99 (except for 2003-04). Recorded in all seasons (29% in spring). Average 4.9, median 3 with max 61/27 Aug Callum Brae NR (SmA1). Breeding: 60 records (44 last year): first ih/7 Aug Wanniassa Hills (CaR3) and last dy/12 Feb Melba (KiB1) with an early start to next season ih/25 Jun Wanniassa Hills (BaL1).
GBS: Records from 56 sites from all weeks with very little seasonal variation (winter 28%). Abundance 4% higher than last year but 6% lower than the 30YA. Average 2.8, median 2 with max 36/3wk Mar Cook (DcA1). Breeding recorded from 10 sites: earliest ih/3wk Aug Watson (WaK1) and last dy/1wk Mar Ainslie (HoS1) with numerous inspecting hollow records after that, the latest being ih/4wk Apr Kambah (VeP1).
Abundance
Abundance is the average number of birds of that species per survey. Where the species was observed (presence recorded) but the number of birds seen was not recorded, this is treated as a count of zero.
Abundance by year
This chart shows the abundance of Eastern Rosella between 1982 and 2017. 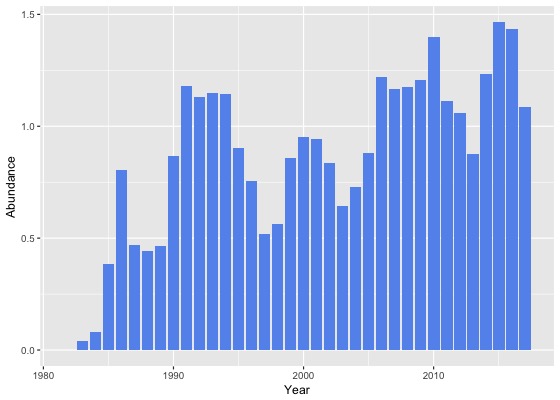
Abundance by month
This chart shows the monthly abundance of Eastern Rosella. The blue lines show the abundance for the twelve months to June 2017 and the bars show the average abundance for the period 1982 to 2017. 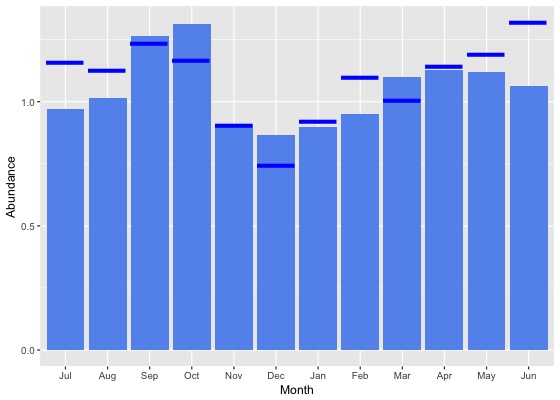
Abundance by season
This chart shows the seasonal abundance of Eastern Rosella. The blue lines show the seasonal abundance for the twelve months to June 2017 and the bars show the average seasonal abundance for the period 1982 to 2017. 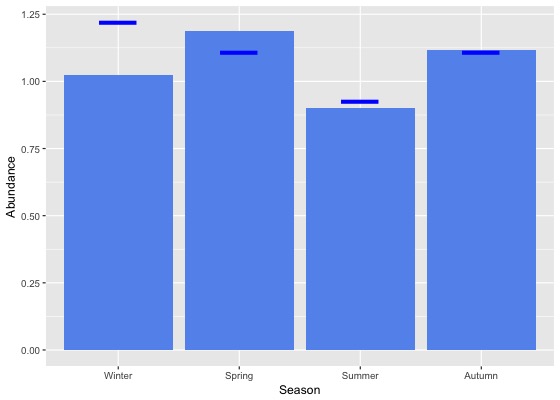
Abundance data
| Month | Season | ||||||||||||||||||
|---|---|---|---|---|---|---|---|---|---|---|---|---|---|---|---|---|---|---|---|
| Period | Jul | Aug | Sep | Oct | Nov | Dec | Jan | Feb | Mar | Apr | May | Jun | Winter | Spring | Summer | Autumn | All | ||
| All years | |||||||||||||||||||
| All | 1.0 | 1.0 | 1.3 | 1.3 | 0.9 | 0.9 | 0.9 | 0.9 | 1.1 | 1.1 | 1.1 | 1.1 | 1.0 | 1.2 | 0.9 | 1.1 | 1.1 | ||
| Previous years | |||||||||||||||||||
| All previous years | 0.9 | 1.0 | 1.3 | 1.3 | 0.9 | 0.9 | 0.9 | 0.9 | 1.1 | 1.1 | 1.1 | 1.0 | 1.0 | 1.2 | 0.9 | 1.1 | 1.1 | ||
| Previous 30 years | 1.0 | 1.0 | 1.3 | 1.3 | 0.9 | 0.9 | 0.9 | 0.9 | 1.1 | 1.1 | 1.1 | 1.0 | 1.0 | 1.2 | 0.9 | 1.1 | 1.1 | ||
| Previous 20 years | 1.0 | 1.1 | 1.4 | 1.4 | 1.0 | 1.0 | 0.9 | 1.0 | 1.2 | 1.2 | 1.2 | 1.1 | 1.1 | 1.3 | 1.0 | 1.2 | 1.1 | ||
| 10 year groups | |||||||||||||||||||
| [2007,2017) | 1.2 | 1.3 | 1.6 | 1.6 | 1.1 | 1.1 | 1.0 | 1.0 | 1.3 | 1.3 | 1.3 | 1.2 | 1.2 | 1.5 | 1.0 | 1.3 | 1.3 | ||
| [1997,2007) | 0.7 | 0.7 | 1.1 | 1.0 | 0.8 | 0.7 | 0.7 | 0.8 | 1.0 | 0.9 | 0.8 | 0.9 | 0.8 | 1.0 | 0.7 | 0.9 | 0.9 | ||
| [1987,1997) | 0.6 | 0.6 | 0.7 | 0.9 | 0.6 | 0.6 | 0.7 | 0.6 | 0.8 | 0.8 | 0.9 | 0.6 | 0.6 | 0.7 | 0.6 | 0.9 | 0.7 | ||
| 5 year groups | |||||||||||||||||||
| [2012,2017) | 1.4 | 1.4 | 1.5 | 1.6 | 1.0 | 1.1 | 1.0 | 1.0 | 1.3 | 1.5 | 1.4 | 1.3 | 1.3 | 1.4 | 1.0 | 1.4 | 1.3 | ||
| [2007,2012) | 0.9 | 1.0 | 1.7 | 1.4 | 1.4 | 1.1 | 1.0 | 1.1 | 1.2 | 0.9 | 1.1 | 1.1 | 1.0 | 1.5 | 1.1 | 1.1 | 1.2 | ||
| [2002,2007) | 0.8 | 0.8 | 1.1 | 1.0 | 0.9 | 0.8 | 0.6 | 0.7 | 1.1 | 0.9 | 0.7 | 1.0 | 0.9 | 1.0 | 0.7 | 0.9 | 0.9 | ||
| [1997,2002) | 0.6 | 0.7 | 1.1 | 1.0 | 0.8 | 0.7 | 0.8 | 1.0 | 0.9 | 0.9 | 0.9 | 0.8 | 0.7 | 1.0 | 0.8 | 0.9 | 0.8 | ||
| [1992,1997) | 0.9 | 0.9 | 1.0 | 1.5 | 0.9 | 0.8 | 1.0 | 0.9 | 1.0 | 0.8 | 1.2 | 0.7 | 0.8 | 1.2 | 0.9 | 1.0 | 1.0 | ||
| [1987,1992) | 0.5 | 0.5 | 0.6 | 0.5 | 0.4 | 0.4 | 0.5 | 0.5 | 0.7 | 0.9 | 0.8 | 0.6 | 0.5 | 0.5 | 0.5 | 0.8 | 0.6 | ||
| Year | |||||||||||||||||||
| 2017 | 1.2 | 1.1 | 1.2 | 1.2 | 0.9 | 0.7 | 0.9 | 1.1 | 1.0 | 1.1 | 1.2 | 1.3 | 1.2 | 1.1 | 0.9 | 1.1 | 1.1 | ||
| 2016 | 1.5 | 1.5 | 1.6 | 2.2 | 1.0 | 1.1 | 1.1 | 1.0 | 1.6 | 1.5 | 1.5 | 1.1 | 1.4 | 1.7 | 1.1 | 1.6 | 1.4 | ||
| 2015 | 1.3 | 1.8 | 2.0 | 1.6 | 0.9 | 1.1 | 1.4 | 1.2 | 1.0 | 1.7 | 1.8 | 1.8 | 1.7 | 1.5 | 1.2 | 1.5 | 1.5 | ||
| 2014 | 1.0 | 1.5 | 1.0 | 1.4 | 1.2 | 0.9 | 1.1 | 1.3 | 1.4 | 1.7 | 1.2 | 1.1 | 1.2 | 1.2 | 1.1 | 1.4 | 1.2 | ||
| 2013 | 0.7 | 0.9 | 0.9 | 1.2 | 1.2 | 0.9 | 0.5 | 0.7 | 1.0 | 0.8 | 0.6 | 0.9 | 0.8 | 1.1 | 0.7 | 0.8 | 0.9 | ||
| 2012 | 1.9 | 0.6 | 1.4 | 1.2 | 0.9 | 1.3 | 0.5 | 0.4 | 0.8 | 1.4 | 1.1 | 1.0 | 1.2 | 1.2 | 0.7 | 1.1 | 1.1 | ||
| 2011 | 1.0 | 1.1 | 2.0 | 1.9 | 1.4 | 0.7 | 0.8 | 0.7 | 0.7 | 1.0 | 0.5 | 1.2 | 1.2 | 1.8 | 0.7 | 0.7 | 1.1 | ||
| 2010 | 1.2 | 1.1 | 1.5 | 1.8 | 1.6 | 1.2 | 1.1 | 2.0 | 1.4 | 0.9 | 1.9 | 1.1 | 1.1 | 1.7 | 1.3 | 1.3 | 1.4 | ||
| 2009 | 0.5 | 1.1 | 1.8 | 1.5 | 1.2 | 1.2 | 1.1 | 1.0 | 1.3 | 0.8 | 0.6 | 1.1 | 0.9 | 1.5 | 1.1 | 1.0 | 1.2 | ||
| 2008 | 0.6 | 1.2 | 1.5 | 1.0 | 1.5 | 1.3 | 1.5 | 1.0 | 1.2 | 1.0 | 1.9 | 1.2 | 1.0 | 1.2 | 1.3 | 1.2 | 1.2 | ||
| 2007 | 1.1 | 0.5 | 1.7 | 1.1 | 1.3 | 1.4 | 0.8 | 1.4 | 1.3 | 0.9 | 1.7 | 1.0 | 0.9 | 1.3 | 1.2 | 1.2 | 1.2 | ||
| 2006 | 0.8 | 1.2 | 1.4 | 1.7 | 1.1 | 1.1 | 1.1 | 0.7 | 1.2 | 1.3 | 0.9 | 1.3 | 1.1 | 1.5 | 1.0 | 1.2 | 1.2 | ||
| 2005 | 0.8 | 0.5 | 1.0 | 0.5 | 1.2 | 1.0 | 0.8 | 0.8 | 1.1 | 0.5 | 0.8 | 1.2 | 0.9 | 0.9 | 0.9 | 0.8 | 0.9 | ||
| 2004 | 0.4 | 0.7 | 0.9 | 0.6 | 0.5 | 0.4 | 0.5 | 1.1 | 1.1 | 1.0 | 0.9 | 1.0 | 0.7 | 0.7 | 0.6 | 1.0 | 0.7 | ||
| 2003 | 0.7 | 0.7 | 0.9 | 0.7 | 0.7 | 0.6 | 0.3 | 0.4 | 0.7 | 0.8 | 0.4 | 0.6 | 0.7 | 0.8 | 0.4 | 0.7 | 0.6 | ||
| 2002 | 1.2 | 0.9 | 1.1 | 0.6 | 0.9 | 0.8 | 0.5 | 0.6 | 1.2 | 0.7 | 0.6 | 0.7 | 0.9 | 0.9 | 0.7 | 0.9 | 0.8 | ||
| 2001 | 0.6 | 0.7 | 1.1 | 1.0 | 1.0 | 1.0 | 0.8 | 1.2 | 1.0 | 1.1 | 0.9 | 0.7 | 0.7 | 1.0 | 1.0 | 1.0 | 0.9 | ||
| 2000 | 0.9 | 0.8 | 1.3 | 1.1 | 0.7 | 0.5 | 0.7 | 1.3 | 1.2 | 1.0 | 0.7 | 1.2 | 1.0 | 1.1 | 0.8 | 1.0 | 0.9 | ||
| 1999 | 0.2 | 0.5 | 1.1 | 0.8 | 0.8 | 0.8 | 0.9 | 0.7 | 0.8 | 0.8 | 1.2 | 0.9 | 0.7 | 0.9 | 0.8 | 0.9 | 0.9 | ||
| 1998 | 0.6 | 0.5 | 1.3 | 1.1 | 0.6 | 0.4 | 0.3 | 0.3 | 0.2 | 0.2 | 0.4 | 0.1 | 0.3 | 1.0 | 0.3 | 0.2 | 0.6 | ||
| 1997 | 0.3 | 0.6 | 0.3 | 0.8 | 0.8 | 0.2 | 1.0 | 0.5 | 1.1 | 0.6 | 0.2 | 0.0 | 0.3 | 0.6 | 0.5 | 0.6 | 0.5 | ||
| 1996 | 0.5 | 1.1 | 1.1 | 1.3 | 0.8 | 0.6 | 0.7 | 0.4 | 0.2 | 0.5 | 0.4 | 1.2 | 1.0 | 1.0 | 0.6 | 0.4 | 0.8 | ||
| 1995 | 1.1 | 0.3 | 0.5 | 1.1 | 0.3 | 0.7 | 0.9 | 1.0 | 1.8 | 1.0 | 1.4 | 0.9 | 0.7 | 0.7 | 0.9 | 1.4 | 0.9 | ||
| 1994 | 1.0 | 1.4 | 1.7 | 2.2 | 1.2 | 1.0 | 2.0 | 0.9 | 0.8 | 0.6 | 0.5 | 0.6 | 1.0 | 1.6 | 1.4 | 0.7 | 1.1 | ||
| 1993 | 0.5 | 1.5 | 0.8 | 2.4 | 1.7 | 1.3 | 0.9 | 0.2 | 1.0 | 0.4 | 1.8 | 0.3 | 0.8 | 1.7 | 0.9 | 1.1 | 1.1 | ||
| 1992 | 1.5 | 0.7 | 1.2 | 1.2 | 0.9 | 0.9 | 0.2 | 2.3 | 1.1 | 1.5 | 1.9 | 0.2 | 0.8 | 1.1 | 1.0 | 1.5 | 1.1 | ||
| 1991 | 0.9 | 1.0 | 1.4 | 1.1 | 0.9 | 0.4 | 1.1 | 1.1 | 2.0 | 1.1 | 2.6 | 1.1 | 1.0 | 1.1 | 0.8 | 1.9 | 1.2 | ||
| 1990 | 0.4 | 0.3 | 0.2 | 0.2 | 0.3 | 0.3 | 0.6 | 0.7 | 1.7 | 3.9 | 1.9 | 1.4 | 0.5 | 0.2 | 0.5 | 2.5 | 0.9 | ||
| 1989 | 0.4 | 0.6 | 0.5 | 0.5 | 0.4 | 0.4 | 0.5 | 0.5 | 0.5 | 0.4 | 0.4 | 0.5 | 0.5 | 0.5 | 0.5 | 0.4 | 0.5 | ||
| 1988 | 0.4 | 0.4 | 0.5 | 0.5 | 0.4 | 0.5 | 0.4 | 0.5 | 0.4 | 0.5 | 0.4 | 0.4 | 0.4 | 0.5 | 0.5 | 0.4 | 0.4 | ||
| 1987 | 0.8 | 0.1 | 0.5 | 0.6 | 0.4 | 0.5 | 0.6 | 0.4 | 0.4 | 0.5 | 0.4 | 0.4 | 0.4 | 0.5 | 0.5 | 0.4 | 0.5 | ||
| 1986 | 0.3 | 0.8 | 0.4 | 1.1 | 0.4 | 0.3 | 2.3 | 0.7 | 1.1 | 1.2 | 0.7 | 0.9 | 0.7 | 0.6 | 1.0 | 1.0 | 0.8 | ||
| 1985 | 0.3 | 0.7 | 0.2 | 0.3 | 0.3 | 0.3 | 0.2 | 1.1 | 0.4 | 0.6 | 1.1 | 0.3 | 0.4 | 0.3 | 0.4 | 0.7 | 0.4 | ||
| 1984 | 0.0 | 0.0 | 0.0 | 0.0 | 0.0 | 0.0 | 0.4 | 0.0 | 0.1 | 0.1 | 0.1 | 0.0 | 0.0 | 0.0 | 0.2 | 0.1 | 0.1 | ||
| 1983 | 0.0 | 0.0 | 0.0 | 0.0 | 0.3 | 0.1 | 0.0 | 0.0 | 0.0 | - | 0.0 | 0.0 | 0.0 | 0.1 | 0.0 | 0.0 | 0.0 | ||
| 1982 | - | 0.0 | - | 0.0 | 0.0 | 0.0 | - | 0.0 | - | 0.0 | - | 0.0 | 0.0 | 0.0 | 0.0 | 0.0 | 0.0 | ||
Reporting rates
Reporting rate is the proportion of all surveys in which the species was present.
Reporting rate by year
This chart shows the reporting rate of Eastern Rosella each year between 1982 and 2017. 
Reporting rate by month
This chart shows the reporting rate by month of Eastern Rosella. The blue lines show the reporting rate for the twelve months to June 2017 and the bars show the average reporting rate for the period 1982 to 2017. 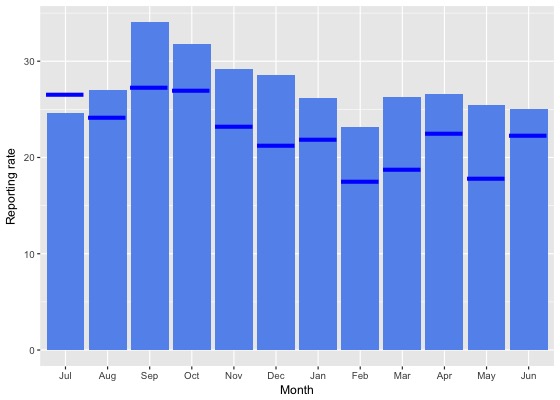
Reporting rate by season
This chart shows the seasonal reporting rate of Eastern Rosella. The blue lines show the seasonal reporting rate for the twelve months to June 2017 and the bars show the average seasonal reporting rate for the period 1982 to 2017. 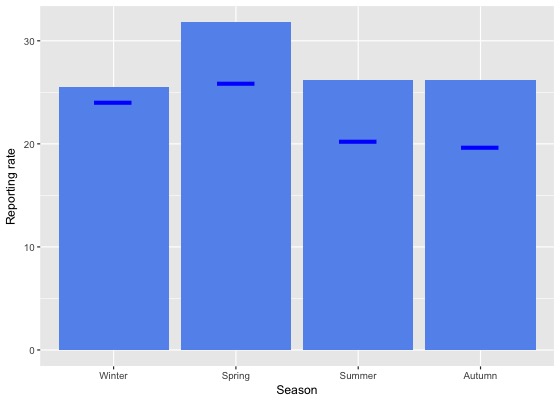
Reporting rate data
| Month | Season | ||||||||||||||||||
|---|---|---|---|---|---|---|---|---|---|---|---|---|---|---|---|---|---|---|---|
| Period | Jul | Aug | Sep | Oct | Nov | Dec | Jan | Feb | Mar | Apr | May | Jun | Winter | Spring | Summer | Autumn | All | ||
| All years | |||||||||||||||||||
| All | 24.6 | 27.0 | 34.0 | 31.8 | 29.2 | 28.6 | 26.2 | 23.2 | 26.3 | 26.6 | 25.5 | 25.1 | 25.5 | 31.8 | 26.2 | 26.2 | 27.7 | ||
| Previous years | |||||||||||||||||||
| All previous years | 24.3 | 27.5 | 35.0 | 32.5 | 30.2 | 29.7 | 27.0 | 24.4 | 27.7 | 27.3 | 27.3 | 25.6 | 25.8 | 32.6 | 27.2 | 27.4 | 28.6 | ||
| Previous 30 years | 24.4 | 27.7 | 35.2 | 32.7 | 30.3 | 30.0 | 27.0 | 24.6 | 27.7 | 27.4 | 27.3 | 25.8 | 26.0 | 32.8 | 27.4 | 27.5 | 28.8 | ||
| Previous 20 years | 22.0 | 27.1 | 34.7 | 32.0 | 28.5 | 29.1 | 25.7 | 22.7 | 26.7 | 26.4 | 25.7 | 25.0 | 24.8 | 32.0 | 26.1 | 26.4 | 27.7 | ||
| 10 year groups | |||||||||||||||||||
| [2007,2017) | 24.2 | 29.4 | 35.5 | 32.8 | 29.8 | 29.8 | 26.0 | 22.6 | 26.9 | 26.9 | 26.8 | 26.4 | 26.7 | 32.9 | 26.3 | 26.9 | 28.5 | ||
| [1997,2007) | 18.3 | 22.1 | 33.1 | 29.5 | 26.0 | 27.7 | 24.5 | 23.1 | 26.3 | 25.2 | 23.1 | 21.9 | 20.8 | 29.8 | 25.5 | 25.1 | 25.7 | ||
| [1987,1997) | 32.7 | 29.4 | 38.1 | 36.7 | 36.2 | 35.6 | 35.1 | 33.3 | 33.2 | 32.3 | 33.5 | 29.8 | 30.6 | 36.9 | 34.7 | 33.0 | 34.0 | ||
| 5 year groups | |||||||||||||||||||
| [2012,2017) | 25.5 | 30.9 | 33.1 | 33.3 | 28.5 | 29.0 | 26.0 | 22.7 | 26.2 | 27.8 | 27.1 | 26.0 | 27.4 | 32.0 | 25.9 | 27.0 | 28.2 | ||
| [2007,2012) | 20.4 | 24.4 | 40.8 | 31.8 | 33.3 | 31.4 | 25.8 | 21.9 | 29.1 | 24.8 | 25.9 | 27.1 | 24.9 | 34.5 | 27.4 | 26.6 | 29.2 | ||
| [2002,2007) | 20.1 | 23.9 | 35.3 | 28.2 | 24.5 | 28.7 | 20.4 | 20.8 | 27.4 | 25.9 | 20.9 | 22.7 | 22.1 | 29.7 | 24.3 | 25.4 | 25.6 | ||
| [1997,2002) | 15.5 | 19.9 | 30.6 | 31.3 | 27.8 | 26.3 | 29.1 | 25.4 | 24.8 | 24.3 | 25.8 | 20.8 | 19.0 | 30.0 | 26.9 | 24.9 | 25.7 | ||
| [1992,1997) | 20.0 | 17.1 | 24.2 | 22.7 | 31.5 | 24.6 | 16.9 | 16.5 | 19.8 | 15.8 | 23.6 | 15.0 | 17.2 | 26.2 | 19.4 | 19.5 | 20.9 | ||
| [1987,1992) | 38.4 | 36.1 | 44.7 | 44.4 | 38.5 | 40.4 | 45.1 | 39.7 | 41.1 | 41.8 | 38.6 | 38.2 | 37.5 | 42.3 | 41.7 | 40.5 | 40.6 | ||
| Year | |||||||||||||||||||
| 2017 | 26.6 | 24.2 | 27.3 | 26.9 | 23.2 | 21.3 | 21.9 | 17.5 | 18.8 | 22.6 | 17.8 | 22.3 | 24.0 | 25.9 | 20.3 | 19.7 | 22.4 | ||
| 2016 | 27.0 | 29.7 | 30.1 | 32.3 | 29.7 | 27.7 | 23.5 | 19.3 | 27.9 | 27.8 | 27.6 | 22.4 | 26.5 | 30.9 | 23.2 | 27.7 | 27.1 | ||
| 2015 | 22.8 | 38.5 | 40.3 | 35.7 | 22.5 | 27.0 | 28.6 | 25.4 | 22.2 | 26.9 | 31.0 | 31.0 | 30.9 | 33.5 | 27.1 | 26.3 | 29.4 | ||
| 2014 | 29.7 | 35.7 | 35.1 | 36.4 | 34.1 | 31.4 | 31.7 | 28.5 | 28.5 | 30.2 | 21.0 | 26.4 | 29.9 | 35.5 | 30.7 | 27.3 | 31.1 | ||
| 2013 | 24.1 | 24.9 | 32.5 | 33.3 | 36.7 | 29.6 | 24.7 | 24.0 | 25.9 | 27.0 | 25.1 | 21.7 | 23.4 | 34.0 | 26.5 | 26.1 | 28.2 | ||
| 2012 | 24.9 | 22.0 | 26.4 | 29.5 | 23.8 | 32.9 | 21.4 | 18.5 | 25.9 | 28.1 | 24.6 | 26.2 | 24.6 | 27.3 | 24.7 | 26.5 | 26.0 | ||
| 2011 | 26.8 | 24.0 | 42.2 | 38.0 | 33.3 | 26.5 | 27.5 | 16.9 | 21.2 | 23.5 | 17.1 | 20.1 | 22.3 | 38.3 | 24.5 | 20.8 | 26.9 | ||
| 2010 | 22.9 | 25.4 | 36.3 | 34.9 | 32.5 | 32.4 | 30.9 | 35.3 | 35.4 | 24.7 | 37.3 | 31.7 | 28.4 | 34.8 | 32.3 | 31.5 | 32.3 | ||
| 2009 | 18.7 | 29.2 | 41.4 | 30.9 | 27.7 | 32.8 | 22.7 | 21.7 | 31.2 | 25.0 | 22.1 | 25.7 | 24.3 | 32.9 | 26.6 | 26.6 | 28.8 | ||
| 2008 | 16.6 | 27.8 | 42.3 | 26.6 | 39.6 | 36.9 | 28.6 | 20.4 | 30.1 | 24.5 | 29.7 | 34.6 | 27.4 | 32.8 | 30.7 | 27.1 | 30.0 | ||
| 2007 | 17.6 | 15.7 | 41.9 | 29.2 | 36.5 | 31.2 | 19.7 | 23.5 | 30.2 | 26.9 | 36.6 | 27.0 | 22.9 | 34.2 | 25.5 | 30.2 | 28.9 | ||
| 2006 | 21.7 | 27.2 | 37.9 | 31.5 | 23.2 | 36.3 | 27.5 | 30.4 | 27.0 | 30.1 | 22.5 | 29.5 | 26.7 | 31.6 | 31.5 | 26.9 | 29.3 | ||
| 2005 | 18.4 | 16.8 | 33.1 | 21.5 | 22.1 | 30.7 | 19.1 | 20.7 | 28.6 | 24.6 | 21.4 | 24.4 | 21.2 | 26.9 | 25.4 | 25.0 | 24.7 | ||
| 2004 | 16.7 | 23.7 | 30.3 | 25.0 | 22.7 | 20.7 | 18.2 | 17.2 | 24.9 | 24.7 | 21.4 | 17.2 | 18.7 | 26.3 | 19.1 | 24.1 | 22.0 | ||
| 2003 | 18.8 | 25.2 | 37.3 | 30.6 | 23.4 | 25.4 | 16.3 | 15.9 | 26.9 | 29.0 | 18.6 | 13.7 | 18.9 | 30.6 | 20.1 | 25.8 | 24.5 | ||
| 2002 | 25.7 | 26.3 | 38.3 | 28.3 | 30.0 | 30.7 | 19.5 | 20.4 | 29.5 | 19.6 | 20.0 | 23.7 | 25.1 | 32.0 | 25.5 | 24.3 | 27.0 | ||
| 2001 | 16.9 | 24.7 | 34.1 | 40.3 | 37.5 | 40.6 | 34.0 | 29.4 | 22.9 | 27.8 | 24.9 | 23.2 | 21.2 | 36.9 | 35.4 | 24.8 | 29.9 | ||
| 2000 | 21.4 | 21.6 | 37.7 | 36.6 | 29.2 | 20.4 | 28.9 | 26.7 | 33.1 | 28.8 | 26.4 | 26.9 | 23.7 | 34.5 | 24.9 | 30.1 | 28.5 | ||
| 1999 | 11.8 | 12.4 | 29.9 | 25.8 | 29.2 | 30.6 | 32.1 | 25.7 | 24.9 | 23.2 | 29.0 | 23.8 | 19.4 | 28.3 | 29.5 | 25.6 | 26.1 | ||
| 1998 | 13.5 | 20.8 | 26.0 | 13.0 | 18.6 | 11.3 | 17.6 | 17.0 | 11.8 | 12.8 | 25.9 | 4.0 | 11.5 | 19.8 | 14.5 | 14.5 | 15.9 | ||
| 1997 | 5.7 | 13.8 | 11.8 | 21.1 | 17.9 | 14.4 | 17.6 | 14.0 | 20.0 | 14.7 | 15.6 | 6.9 | 8.3 | 16.5 | 15.1 | 16.0 | 14.1 | ||
| 1996 | 13.4 | 12.8 | 25.3 | 21.1 | 26.9 | 22.2 | 15.5 | 11.8 | 10.8 | 12.5 | 15.5 | 20.7 | 15.7 | 24.2 | 16.7 | 12.5 | 17.7 | ||
| 1995 | 20.4 | 11.6 | 14.6 | 14.6 | 14.5 | 16.1 | 17.7 | 17.5 | 23.5 | 12.9 | 28.6 | 14.9 | 15.2 | 14.6 | 17.1 | 20.4 | 16.7 | ||
| 1994 | 27.5 | 26.0 | 47.1 | 34.9 | 46.3 | 26.1 | 20.6 | 12.1 | 19.3 | 16.0 | 15.0 | 14.6 | 21.7 | 43.1 | 19.2 | 16.7 | 26.1 | ||
| 1993 | 14.3 | 24.4 | 19.4 | 24.0 | 37.9 | 41.3 | 18.4 | 21.9 | 22.2 | 13.3 | 27.3 | 11.6 | 17.3 | 27.1 | 27.6 | 21.6 | 23.0 | ||
| 1992 | 24.6 | 14.8 | 20.0 | 26.6 | 30.6 | 27.0 | 12.1 | 26.8 | 25.4 | 27.1 | 30.3 | 11.7 | 17.3 | 25.5 | 21.6 | 27.7 | 23.4 | ||
| 1991 | 20.5 | 11.7 | 24.4 | 24.3 | 25.8 | 9.5 | 21.4 | 18.0 | 28.6 | 27.1 | 31.1 | 30.0 | 19.2 | 24.8 | 15.6 | 29.0 | 22.2 | ||
| 1990 | 42.6 | 31.4 | 20.4 | 25.5 | 31.8 | 30.6 | 34.7 | 25.4 | 28.4 | 31.0 | 26.0 | 31.6 | 35.6 | 26.2 | 30.2 | 28.6 | 30.7 | ||
| 1989 | 41.3 | 46.6 | 48.0 | 46.9 | 40.4 | 39.1 | 49.5 | 39.2 | 42.8 | 42.1 | 37.5 | 36.3 | 41.9 | 45.4 | 42.3 | 41.0 | 42.8 | ||
| 1988 | 42.7 | 39.2 | 53.9 | 46.1 | 42.2 | 48.7 | 38.2 | 48.0 | 44.6 | 45.5 | 39.9 | 43.5 | 41.6 | 46.5 | 44.8 | 43.3 | 44.0 | ||
| 1987 | 45.5 | 33.3 | 51.0 | 55.5 | 40.0 | 48.3 | 58.5 | 42.9 | 45.5 | 46.1 | 44.1 | 38.7 | 38.7 | 48.0 | 49.4 | 45.2 | 46.7 | ||
| 1986 | 34.6 | 31.6 | 28.3 | 38.9 | 38.3 | 20.6 | 30.4 | 38.9 | 38.7 | 35.3 | 48.3 | 37.1 | 34.3 | 34.6 | 30.1 | 39.6 | 34.9 | ||
| 1985 | 6.7 | 23.3 | 7.7 | 11.6 | 12.3 | 11.7 | 12.5 | 23.5 | 18.2 | 26.3 | 50.0 | 25.0 | 18.2 | 10.8 | 14.1 | 30.0 | 15.0 | ||
| 1984 | 0.0 | 0.0 | 0.0 | 0.0 | 0.0 | 0.0 | 13.8 | 0.0 | 3.7 | 2.9 | 3.2 | 2.9 | 2.0 | 0.0 | 5.4 | 3.3 | 3.4 | ||
| 1983 | 0.0 | 0.0 | 0.0 | 0.0 | 33.3 | 7.7 | 0.0 | 0.0 | 0.0 | - | 0.0 | 0.0 | 0.0 | 11.1 | 3.3 | 0.0 | 4.0 | ||
| 1982 | - | 0.0 | - | 0.0 | 0.0 | 0.0 | - | 0.0 | - | 0.0 | - | 0.0 | 0.0 | 0.0 | 0.0 | 0.0 | 0.0 | ||
Breeding data
Breeding records by month
Number of breeding records by breeding code and month, 2017 and all years| Breeding code | Jul | Aug | Sep | Oct | Nov | Dec | Jan | Feb | Mar | Apr | May | Jun |
|---|---|---|---|---|---|---|---|---|---|---|---|---|
| 2017 | ||||||||||||
| Breeding (BLA code) | 0 | 0 | 0 | 0 | 0 | 0 | 0 | 0 | 0 | 0 | 0 | 0 |
| Carrying Food | 0 | 0 | 0 | 0 | 0 | 0 | 0 | 0 | 0 | 0 | 0 | 0 |
| Copulating | 0 | 0 | 0 | 0 | 0 | 0 | 0 | 0 | 0 | 0 | 0 | 0 |
| Display | 0 | 0 | 0 | 0 | 0 | 0 | 0 | 0 | 0 | 0 | 0 | 0 |
| Dependent young | 0 | 0 | 0 | 2 | 0 | 5 | 9 | 1 | 0 | 0 | 0 | 0 |
| Faecal sac | 0 | 0 | 0 | 0 | 0 | 0 | 0 | 0 | 0 | 0 | 0 | 0 |
| Inspecting hollow | 0 | 2 | 10 | 10 | 4 | 1 | 0 | 0 | 0 | 0 | 0 | 1 |
| Nest building | 0 | 0 | 0 | 0 | 0 | 0 | 0 | 0 | 0 | 0 | 0 | 0 |
| Nest with eggs | 0 | 0 | 0 | 0 | 0 | 0 | 0 | 0 | 0 | 0 | 0 | 0 |
| Nest with young | 0 | 0 | 0 | 0 | 0 | 0 | 5 | 0 | 0 | 0 | 0 | 0 |
| On/leaving nest | 0 | 0 | 2 | 4 | 1 | 3 | 0 | 0 | 0 | 0 | 0 | 0 |
| All years | ||||||||||||
| Breeding (BLA code) | 1 | 3 | 0 | 2 | 0 | 0 | 1 | 0 | 0 | 0 | 0 | 0 |
| Carrying Food | 0 | 0 | 0 | 1 | 0 | 0 | 0 | 1 | 0 | 0 | 0 | 0 |
| Copulating | 0 | 0 | 0 | 3 | 0 | 0 | 0 | 0 | 0 | 0 | 0 | 0 |
| Display | 0 | 0 | 0 | 2 | 1 | 0 | 0 | 0 | 0 | 0 | 0 | 0 |
| Dependent young | 0 | 0 | 2 | 19 | 12 | 56 | 39 | 5 | 0 | 2 | 0 | 0 |
| Faecal sac | 0 | 0 | 0 | 0 | 0 | 0 | 0 | 0 | 0 | 0 | 0 | 0 |
| Inspecting hollow | 7 | 35 | 85 | 115 | 34 | 15 | 0 | 0 | 6 | 0 | 2 | 5 |
| Nest building | 0 | 2 | 4 | 17 | 8 | 3 | 3 | 0 | 0 | 0 | 0 | 0 |
| Nest with eggs | 0 | 0 | 2 | 4 | 6 | 1 | 0 | 0 | 0 | 0 | 0 | 0 |
| Nest with young | 0 | 0 | 0 | 2 | 3 | 5 | 6 | 0 | 0 | 0 | 0 | 0 |
| On/leaving nest | 0 | 1 | 12 | 36 | 10 | 7 | 2 | 1 | 0 | 0 | 0 | 0 |
Breeding records by year
Average number of breeding records per period by breeding code| Period | Breeding (BLA code) | Carrying Food | Copulating | Display | Dependent young | Faecal sac | Inspecting hollow | Nest building | Nest with eggs | Nest with young | On/leaving nest |
|---|---|---|---|---|---|---|---|---|---|---|---|
| All years | |||||||||||
| All | 0.2 | 0.1 | 0.1 | 0.1 | 3.8 | 0.0 | 8.4 | 1.0 | 0.4 | 0.4 | 1.9 |
| Previous years | |||||||||||
| All previous years | 0.2 | 0.1 | 0.1 | 0.1 | 3.4 | 0.0 | 7.9 | 1.1 | 0.4 | 0.3 | 1.7 |
| Previous 30 years | 0.2 | 0.1 | 0.1 | 0.1 | 3.9 | 0.0 | 9.2 | 1.2 | 0.4 | 0.4 | 2.0 |
| Previous 20 years | 0.3 | 0.0 | 0.1 | 0.1 | 3.3 | 0.0 | 13.0 | 0.0 | 0.2 | 0.1 | 2.8 |
| 10 year groups | |||||||||||
| [2007,2017) | 0.6 | 0.0 | 0.2 | 0.2 | 5.5 | 0.0 | 18.4 | 0.0 | 0.3 | 0.3 | 4.5 |
| [1997,2007) | 0.1 | 0.0 | 0.1 | 0.1 | 1.1 | 0.0 | 7.6 | 0.0 | 0.1 | 0.0 | 1.1 |
| [1987,1997) | 0.0 | 0.2 | 0.0 | 0.0 | 5.1 | 0.0 | 1.6 | 3.7 | 0.9 | 0.8 | 0.3 |
| 5 year groups | |||||||||||
| [2012,2017) | 1.0 | 0.0 | 0.4 | 0.0 | 6.4 | 0.0 | 21.0 | 0.0 | 0.6 | 0.2 | 4.8 |
| [2007,2012) | 0.2 | 0.0 | 0.0 | 0.4 | 4.6 | 0.0 | 15.8 | 0.0 | 0.0 | 0.4 | 4.2 |
| [2002,2007) | 0.2 | 0.0 | 0.2 | 0.2 | 1.4 | 0.0 | 9.8 | 0.0 | 0.0 | 0.0 | 1.4 |
| [1997,2002) | 0.0 | 0.0 | 0.0 | 0.0 | 0.8 | 0.0 | 5.4 | 0.0 | 0.2 | 0.0 | 0.8 |
| [1992,1997) | 0.0 | 0.0 | 0.0 | 0.0 | 2.4 | 0.0 | 2.8 | 0.6 | 0.0 | 0.0 | 0.6 |
| [1987,1992) | 0.0 | 0.4 | 0.0 | 0.0 | 7.8 | 0.0 | 0.4 | 6.8 | 1.8 | 1.6 | 0.0 |
| Year | |||||||||||
| 2017 | 0.0 | 0.0 | 0.0 | 0.0 | 17.0 | 0.0 | 28.0 | 0.0 | 0.0 | 5.0 | 10.0 |
| 2016 | 0.0 | 0.0 | 1.0 | 0.0 | 4.0 | 0.0 | 32.0 | 0.0 | 0.0 | 0.0 | 7.0 |
| 2015 | 0.0 | 0.0 | 1.0 | 0.0 | 12.0 | 0.0 | 15.0 | 0.0 | 1.0 | 1.0 | 7.0 |
| 2014 | 0.0 | 0.0 | 0.0 | 0.0 | 9.0 | 0.0 | 21.0 | 0.0 | 2.0 | 0.0 | 5.0 |
| 2013 | 1.0 | 0.0 | 0.0 | 0.0 | 3.0 | 0.0 | 25.0 | 0.0 | 0.0 | 0.0 | 3.0 |
| 2012 | 4.0 | 0.0 | 0.0 | 0.0 | 4.0 | 0.0 | 12.0 | 0.0 | 0.0 | 0.0 | 2.0 |
| 2011 | 0.0 | 0.0 | 0.0 | 0.0 | 4.0 | 0.0 | 19.0 | 0.0 | 0.0 | 2.0 | 3.0 |
| 2010 | 0.0 | 0.0 | 0.0 | 0.0 | 5.0 | 0.0 | 16.0 | 0.0 | 0.0 | 0.0 | 7.0 |
| 2009 | 1.0 | 0.0 | 0.0 | 0.0 | 5.0 | 0.0 | 24.0 | 0.0 | 0.0 | 0.0 | 5.0 |
| 2008 | 0.0 | 0.0 | 0.0 | 1.0 | 3.0 | 0.0 | 11.0 | 0.0 | 0.0 | 0.0 | 6.0 |
| 2007 | 0.0 | 0.0 | 0.0 | 1.0 | 6.0 | 0.0 | 9.0 | 0.0 | 0.0 | 0.0 | 0.0 |
| 2006 | 1.0 | 0.0 | 1.0 | 1.0 | 2.0 | 0.0 | 18.0 | 0.0 | 0.0 | 0.0 | 3.0 |
| 2005 | 0.0 | 0.0 | 0.0 | 0.0 | 2.0 | 0.0 | 4.0 | 0.0 | 0.0 | 0.0 | 1.0 |
| 2004 | 0.0 | 0.0 | 0.0 | 0.0 | 2.0 | 0.0 | 10.0 | 0.0 | 0.0 | 0.0 | 0.0 |
| 2003 | 0.0 | 0.0 | 0.0 | 0.0 | 0.0 | 0.0 | 6.0 | 0.0 | 0.0 | 0.0 | 1.0 |
| 2002 | 0.0 | 0.0 | 0.0 | 0.0 | 1.0 | 0.0 | 11.0 | 0.0 | 0.0 | 0.0 | 2.0 |
| 2001 | 0.0 | 0.0 | 0.0 | 0.0 | 1.0 | 0.0 | 7.0 | 0.0 | 1.0 | 0.0 | 1.0 |
| 2000 | 0.0 | 0.0 | 0.0 | 0.0 | 2.0 | 0.0 | 8.0 | 0.0 | 0.0 | 0.0 | 1.0 |
| 1999 | 0.0 | 0.0 | 0.0 | 0.0 | 1.0 | 0.0 | 5.0 | 0.0 | 0.0 | 0.0 | 2.0 |
| 1998 | 0.0 | 0.0 | 0.0 | 0.0 | 0.0 | 0.0 | 5.0 | 0.0 | 0.0 | 0.0 | 0.0 |
| 1997 | 0.0 | 0.0 | 0.0 | 0.0 | 0.0 | 0.0 | 2.0 | 0.0 | 0.0 | 0.0 | 0.0 |
| 1996 | 0.0 | 0.0 | 0.0 | 0.0 | 2.0 | 0.0 | 3.0 | 0.0 | 0.0 | 0.0 | 2.0 |
| 1995 | 0.0 | 0.0 | 0.0 | 0.0 | 2.0 | 0.0 | 4.0 | 1.0 | 0.0 | 0.0 | 1.0 |
| 1994 | 0.0 | 0.0 | 0.0 | 0.0 | 5.0 | 0.0 | 3.0 | 0.0 | 0.0 | 0.0 | 0.0 |
| 1993 | 0.0 | 0.0 | 0.0 | 0.0 | 1.0 | 0.0 | 2.0 | 0.0 | 0.0 | 0.0 | 0.0 |
| 1992 | 0.0 | 0.0 | 0.0 | 0.0 | 2.0 | 0.0 | 2.0 | 2.0 | 0.0 | 0.0 | 0.0 |
| 1991 | 0.0 | 0.0 | 0.0 | 0.0 | 3.0 | 0.0 | 2.0 | 0.0 | 0.0 | 0.0 | 0.0 |
| 1990 | 0.0 | 0.0 | 0.0 | 0.0 | 5.0 | 0.0 | 0.0 | 1.0 | 0.0 | 0.0 | 0.0 |
| 1989 | 0.0 | 2.0 | 0.0 | 0.0 | 9.0 | 0.0 | 0.0 | 15.0 | 3.0 | 2.0 | 0.0 |
| 1988 | 0.0 | 0.0 | 0.0 | 0.0 | 8.0 | 0.0 | 0.0 | 11.0 | 3.0 | 4.0 | 0.0 |
| 1987 | 0.0 | 0.0 | 0.0 | 0.0 | 14.0 | 0.0 | 0.0 | 7.0 | 3.0 | 2.0 | 0.0 |
| 1986 | 0.0 | 0.0 | 0.0 | 0.0 | 0.0 | 0.0 | 0.0 | 0.0 | 0.0 | 0.0 | 0.0 |
| 1985 | 0.0 | 0.0 | 0.0 | 0.0 | 1.0 | 0.0 | 0.0 | 0.0 | 0.0 | 0.0 | 0.0 |
| 1984 | 0.0 | 0.0 | 0.0 | 0.0 | 0.0 | 0.0 | 0.0 | 0.0 | 0.0 | 0.0 | 0.0 |
| 1983 | 0.0 | 0.0 | 0.0 | 0.0 | 0.0 | 0.0 | 0.0 | 0.0 | 0.0 | 0.0 | 0.0 |
| 1982 | 0.0 | 0.0 | 0.0 | 0.0 | 0.0 | 0.0 | 0.0 | 0.0 | 0.0 | 0.0 | 0.0 |
Distribution map
Distribution - 2017
This map shows the observed distribution of the Eastern Rosella for 2017.
The red circles are the grid cells where Eastern Rosella have been reported.
The transparency of the red circles indicate how many surveys sheets were submitted for that grid cell; the darker the red the more reliable the data. Of the 315 grid cells with reports, 83 had only one sheet; an example is grid number F5.
The size of the circle represents the reporting rate. The maximum reporting rate for Eastern Rosella was 100.0% (eg grid number F5) and the minimum was 2.3% (eg grid number J14). 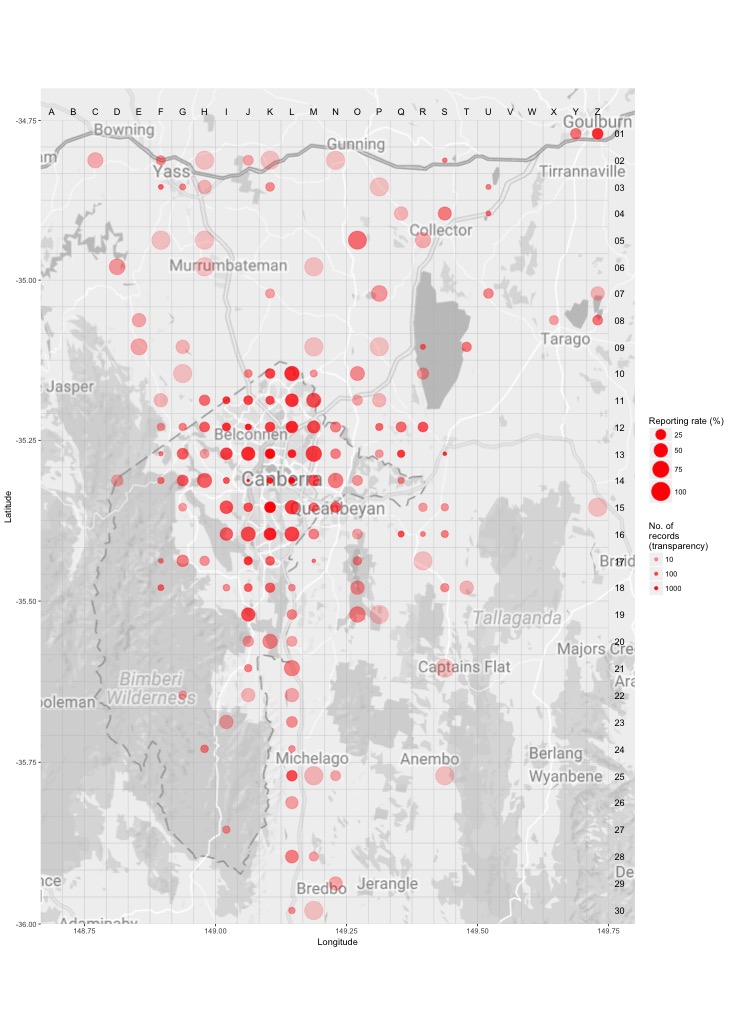
Distribution - all years
This map shows the observed distribution of the Eastern Rosella for all years.
The red circles are the grid cells where Eastern Rosella have been reported.
The transparency of the red circles indicate how many surveys sheets were submitted for that grid cell; the darker the red the more reliable the data. Of the 703 grid cells with reports, 55 had only one sheet; an example is grid number C4.
The size of the circle represents the reporting rate. The maximum reporting rate for Eastern Rosella was 100.0% (eg grid number C4) and the minimum was 0.6% (eg grid number D15). 
Breeding map
Breeding - 2017
This map shows the breeding distribution of the Eastern Rosella for 2017.
The red circles are the grid cells where breeding activity for Eastern Rosella have been reported.
The size of the circle represents the number of reports. 
Breeding - all years
This map shows the breeding distribution of the Eastern Rosella for all years.
The red circles are the grid cells where breeding activity for Eastern Rosella have been reported.
The size of the circle represents the number of reports. 